Introduction: The concept of Cost Functions
Many Supervised Machine Learning models work by exploiting the concept of Cost Functions. We can think of a Cost Function as a function to measure how much a given system or model deviates from an ideal state.
We can typically inject this ideal state into these cost functions. How can we? By using data known to us (truths) as constant within the body of the function. By optimizing these functions we can get an acceptable solution (in the domain space of the function). As a result, this minimizes losses compared to the ideal injected data.
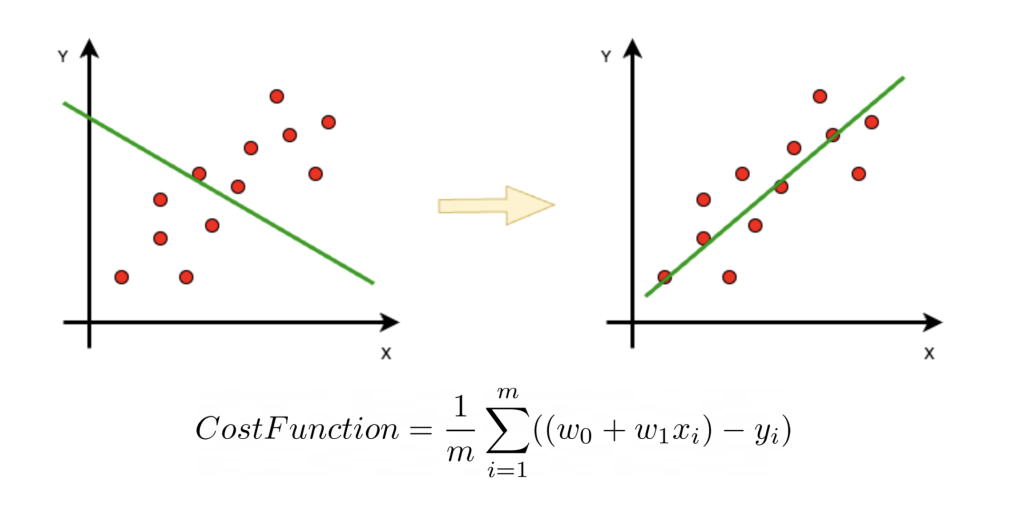
For example, linear regression is a well-known supervised model that allows us to estimate the statistical trend of a phenomenon.
In this case the known data are the points in the chart describing the phenomenon. The model consists of 2 variables w0, w1 describing the orientation of the trend line. The cost function is constructed by a summation on all points that injects the value of each point (x,y) into each individual contribution of the summation.
Optimizing this function of cost regarding the variable ones, we can obtain the values w0,w1 that determine the straight one of the corrected trend.
Use of Cost Functions in Graph Visualization
To define cost functions associated with on-screen graph drawings, we need to define a model first, which is the shape of these functions. Moreover, we also need to think about aesthetic criteria that allow us to inject ideal data.
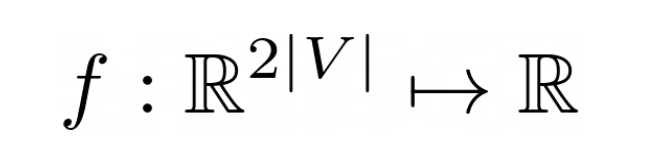
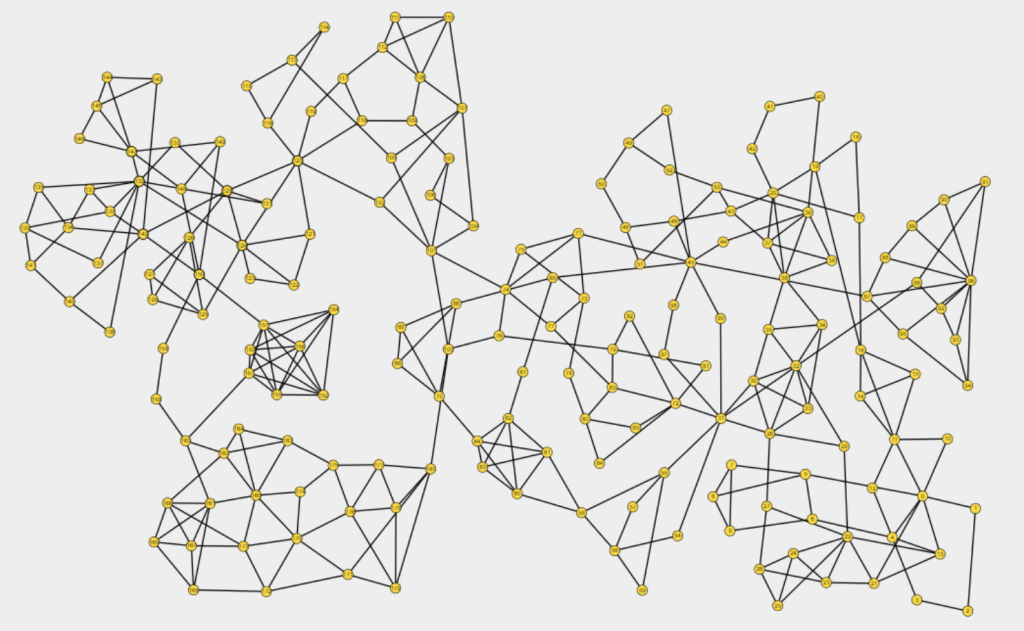
For the choice of model, if we suppose we have a Graph(V,E) composed of |V| nodes, we will have a model composed of 2V variables, that is a vector [x,y] for each node of the graph.
This means that our function will have to take in input the current coordinates of the nodes on the screen and return a number. Hence that number will tell us how much our design is respecting the cost function.
With regard to the formulation of the cost function, it is necessary to think of an aesthetic criterion that the ideal design should respect. In this perspective, for example, it makes sense to think that the topological distances between pairs of nodes (lengths of shortest paths) should be somewhat similar or proportionate to the Euclidean distances of a given design.
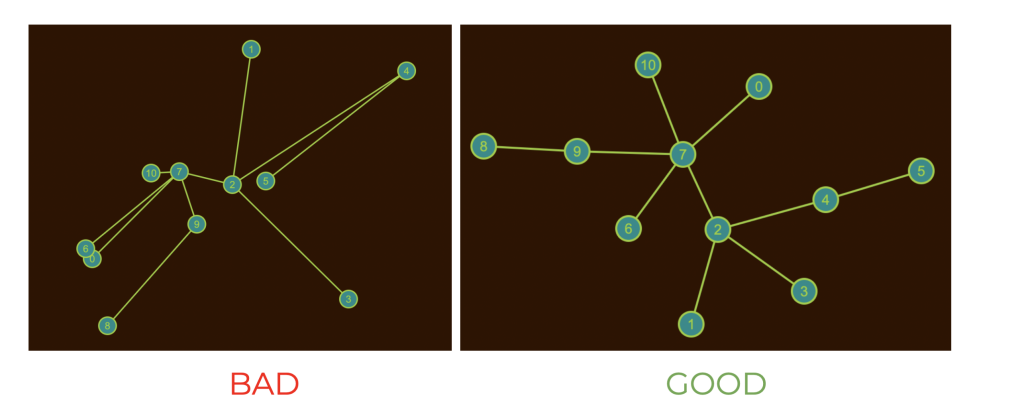
This is generally valid not only for trees, but for all types of graphs.
At this point we have all the pieces to define the cost function:
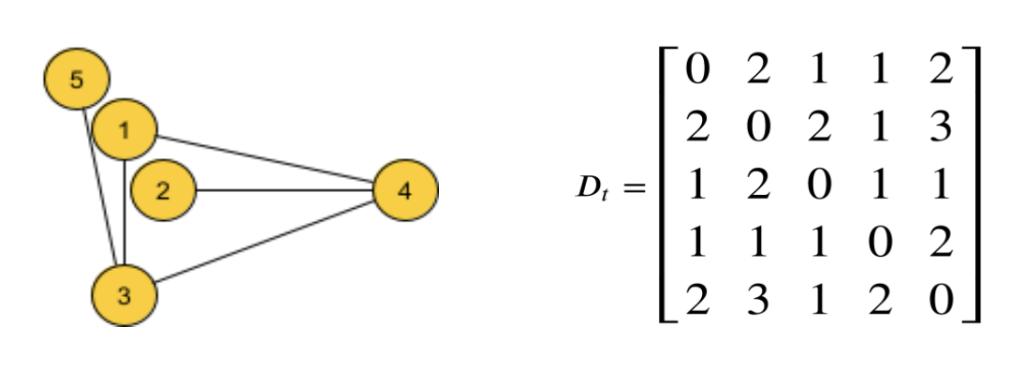
- Function variables are the coordinates of the current nodes
- Ideal data are the values of topological distances between pairs of nodes (D matrix)
and our cost function will be as follows:

The value of this function will be high if the graph is so arranged that topological distances differ greatly from Euclidean distances (BAD). It will be low if topological distances are similar to Euclidean distances (GOOD). Exactly what we wanted!
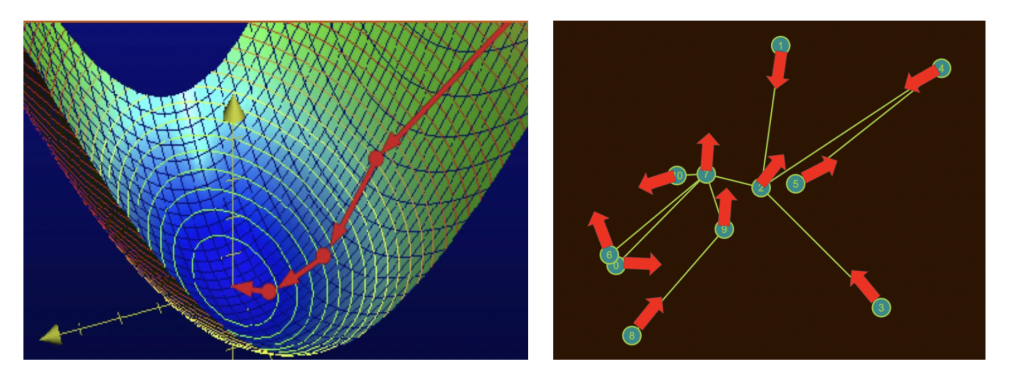
Move the graph in the optimization process
As mentioned above, the functions we have defined are functions having as domain the coordinates of the nodes.

This means that each domain point of our cost function is a possible arrangement of nodes on the screen. Therefore, optimizing that function means for us to move the nodes of the graph!
If we have formulated differentiable functions we can optimize them using the information contained in the gradient direction. For example, we can simply find the minimum point of a parabola starting from any point x of its domain. Then we just need to iteratively update the latter in the opposite direction to its derivative:
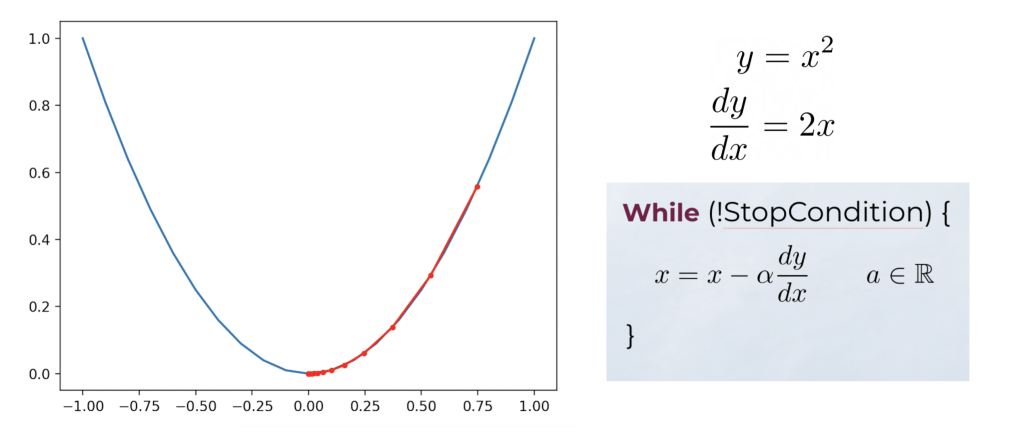
In our case, for example, the Stress Cost Function is a differentiable function in 2|V| variables! The optimization process will be the same, but we will have 2V variables to update, with a gradient vector of 2V partial derivatives.
Conclusion
Stress Cost Function is just one of the possible cost functions associated with aesthetic criteria.
Indeed, exploiting the linearity of the derivation operation it is possible to combine linearly multiple cost functions. In this way the design can conform to multiple aesthetic criteria, producing images very pleasing to the human eye.
A special thanks to our contributor:
Tommaso Zazzaretti