5 reasons to switch to Graph Database
Over time, we started to produce more and more data, until we came to the present day where we hear more and more about Big Data.
We therefore need more innovative technologies to save and analyze this data, as relational databases do not perform well enough when dealing with loads of increasingly large data.
For this reason, we use non relational databases which have been increasingly successful. They have many advantages over relational databases, since they allow, for example, to have a flexible scheme.
In this article we will talk about a specific non relational database: the graph database. We will analyze its potential and present five reasons why the graph database is the most efficient one.
Graph Database
A graph is composed of two elements: nodes and relations.
Each node represents an entity and each relationship provides named and direct connections between two node entities (e.g., Person LOVES Person).
We can mark nodes with labels representing their different roles in the domain (Person, Car) and can contain properties (name, born, twitter etc.).
Relationships always have a direction, a type, an initial node, and a final node. They can have properties, just like nodes.
We can use graphs to represent numerous types of data. They can be data from a social network or, generally, all cases where relationships play a key role.
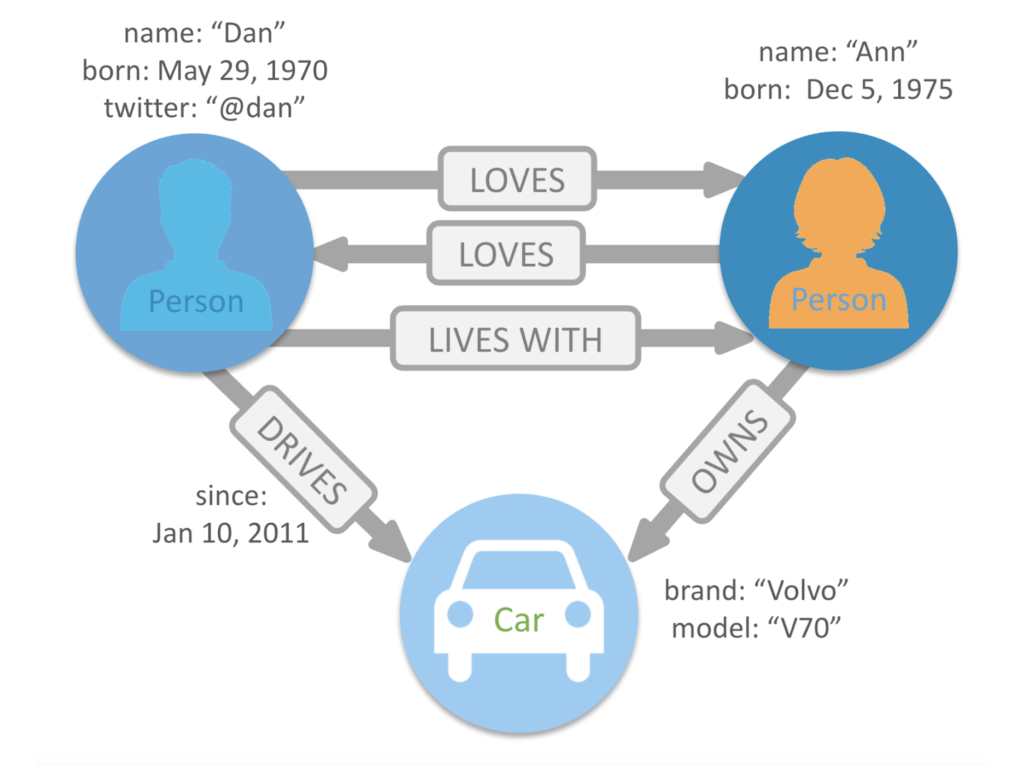
Graph databases store nodes and relationships instead of tables or documents and prefer relationships.
A graph database is an online database management system that uses CRUD operations and works on graph data models.
Furthermore, we can apply graph databases to different sectors and purposes. They help you analyze networked information and understand, evaluate, and leverage processes and connections.
Finally, these databases are ideal for risk analysis, fraud detection and error detection.
Now, let see the 5 reasons to switch to Graph database.
1) Flexibility
Graph databases are designed to save data without limiting it to a fixed model. Indeed, we don’t have an initially defined schema.
They are built on the properties of the graph model that does not impose relational constraints. For this reason any future changes will be easier and faster as we do not need changes to the model. This also makes them reliable for saving data in real time.
As data becomes increasingly complex over time, graph databases are more and more indicated for most use cases, especially those where data manipulation is a priority.
Furthermore, since they do not formally have to comply with constraint rules in order to function, we can use them to represent any data source.
2) Scalability
Data is constantly growing and performing applications cannot be constrained by data volume. They need to scale to handle higher volumes of data while maintaining data performance and integrity.
Graph databases in this case are useful because they allow us to do these things. You can achieve excellent performances even on billions of nodes and trillions of relationships with fast response times.
You can just add to the current structure without interrupting the existing functionality. By their distributed nature, graph databases allow for scaling (horizontal or vertical) as appropriate.
- Vertical scalability. It’s the ability to increase operational capacity by increasing the capacity of a single server to meet higher operational demands. This might include adding more disks, memory, or processing power to a server.
- Horizontal scalability. It’s the ability to increase operational capacity by adding additional servers. The servers themselves may be large servers, but they may also be smaller, inexpensive commodity servers.
3) Easy visualization
As we said before, graph databases prefer relationships. For this reason it is easier and more intuitive to navigate the data than relational databases and then the classic tables. Just think of the data of a social network. If we save all the information of users in tables we lose all the connections between them. Later, during an analysis, it would be more difficult to recover this information.

Instead, by saving the data in a graph database we maintain the connections between them. Because of their correlation, we can recover them in a simpler and faster way, navigating even on deeper levels.
For example, starting from a single node we can construct the graph induced by that node simply expanding it and then recover all the connections with the other nodes within the network.
The graphic structure, unlike the tabular one in the relational db, allows a complete visualization, accessible and understandable to all users, even the less experienced.
Example of graph expansion performed in Galileo.XAI
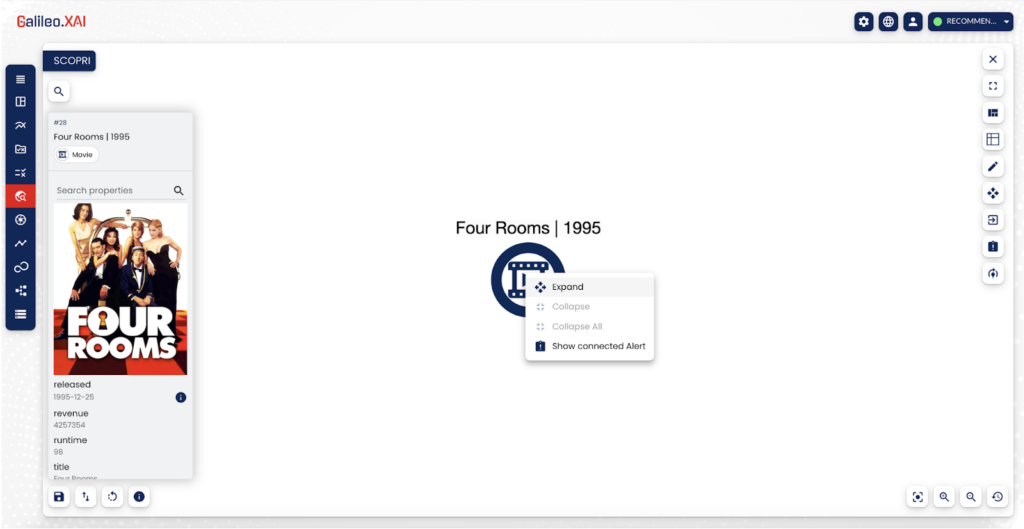
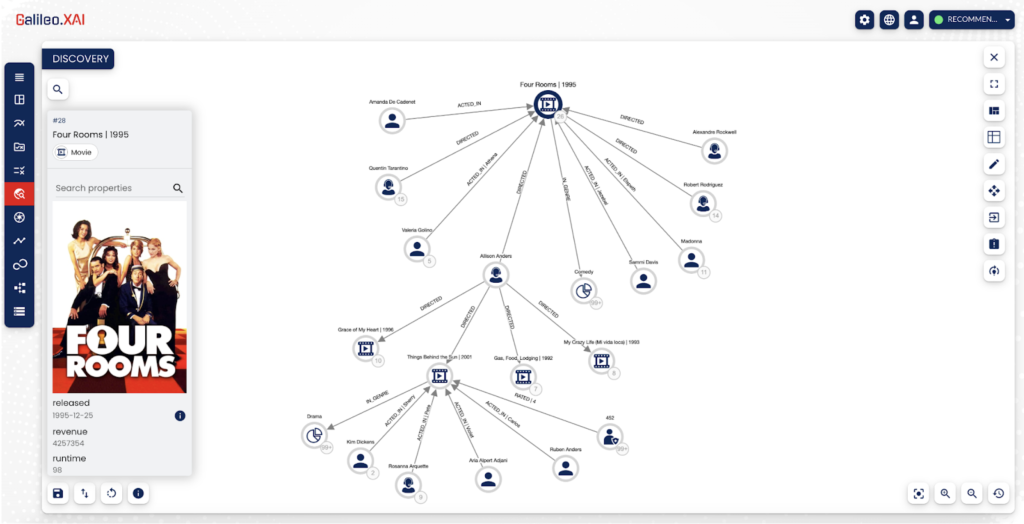
💡 In the example, starting from a specific film “Four Rooms” we can easily expand the node and decide to stop when we have reached the subgraph of interest.
4) Faster query
We live in a connected world and the connections between the elements are as important as the elements themselves.
Although existing relational databases can store relationships between entities, they navigate them through costly operations or cross-searches, often tied to a rigid schema.
To create relationships between multiple entities in a relational database it would be necessary to introduce an associative entity table that contains the external keys of both participating tables. This further increases the costs of joining operations.
In a graph database, relationships are stored natively with nodes in a much more flexible format.
In a Graph Database, everything about the system is optimized to pass through data quickly
Thanks to graph databases, we can therefore save a lot of time in the event that we need to query the database and get information on connected data. Also, we can get results with operations that are much less expensive than the queries that we would need to get the same information from a database based on the tabular model.
The following example is from Neo4j:
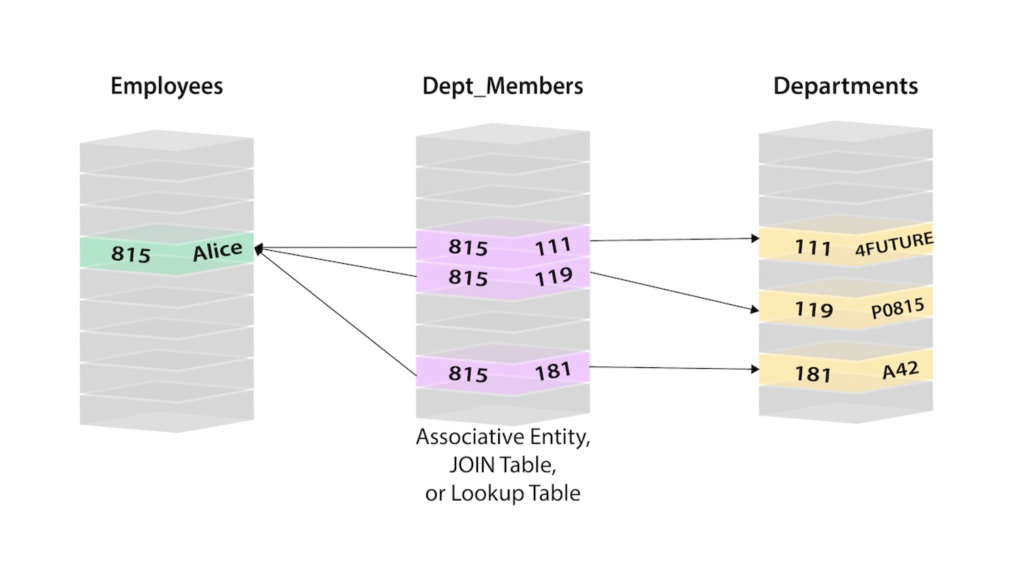
In this case, if you want to retrieve the information about Alice you should search the user Alice and her person ID 815 in the Employees table on the left. Then, in the Dept_Members table you would find all the lines that refer to Alice’s person ID (815). Then you retrieve the 3 relevant rows and go to the Departments table on the right. There you can finally search for the actual values of the ID departments (111, 119, 181).
We know that Alice is part of the 4Future, P0815 and A42 departments only after performing the described operations.
It’s easy to understand how complicated connections are. Here, we would need to know the values of the person ID and the department ID (by performing additional searches to find them) in order to know which person connects to which departments.
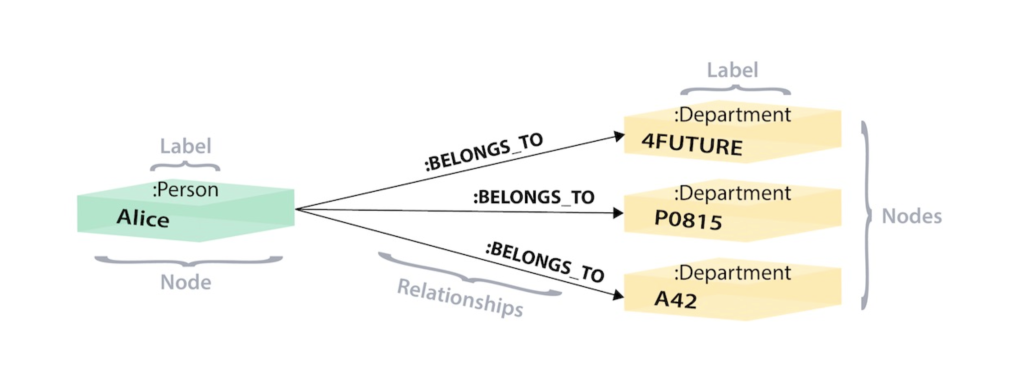
In the graph version, we have a single node for Alice with a Person label. Alice belongs to 3 different departments, so we create a node for each of them with a Department type label.
To find out which departments Alice belongs to, we first search the Alice node in the graph. Then we will go through all the BELONGS_TO relationships from Alice to find the nodes of the department she is connected to.
That’s all we need: a single hop with no research involved.
5) Data analysis
Graph databases have a powerful tool for data analysis, namely the ability to apply algorithms on graphs.
These algorithms give us the opportunity not only to study how the structure of the network is but also to understand how important or similar some nodes within it are. For example, we can analyze the role played by more central compared to those in the periphery. We can investigate the interactions between them or study the communities belonging to nodes with similar characteristics.
Among the various algorithms available for graph databases, we focus on Centrality and Community Detection.
The combination of these analysis allows us to find patterns within the network and to highlight situations that may be significant according to the use case analyzed.
– Centrality
We can use centrality algorithms to determine the importance of distinct nodes in a network. Nodes can be classified as more or less important based on their interactions with other nodes. Each node in the network will therefore receive a score of importance that. The higher the importance, the higher the score.
In some cases we have nodes called ‘broker‘. If removed from the graph, it would lead to a total or partial disconnection of the network.
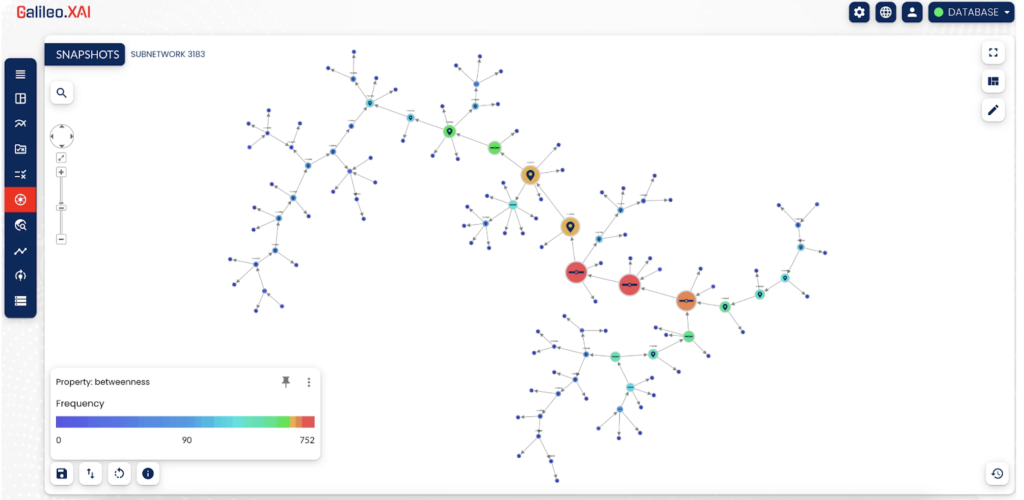
In the example of Galileo.XAI we measure the amount of influence of a node based on the flow of information that connects that node to all the other nodes in the network.
The applied algorithm is Betweenness Centrality of the Neo4j Graph Data Science. We can use it to find the Nodes that act as Bridge from one side to the other.
Even through the heat map in the lower left, you can see which nodes are more or less important based on their score. The higher the score, the more important the node.
In this case the nodes in red are the most important for this subnetwork. It is easy to understand why. If we delete these nodes, we would disconnect the subnetwork and loose the communications between the nodes.
– Community detection
We can use community detection algorithms to evaluate how groups of nodes are grouped or partitioned, as well as their tendency to strengthen or separate.
Usually, nodes group nodes in a community based on their interactions.
Each community is made up of nodes that have many interactions, which are therefore densely connected. This type of algorithms helps to better understand the structure of the network, as through the communities we can understand which are the nodes that interact more and similarly those that interact less and therefore are in different communities.
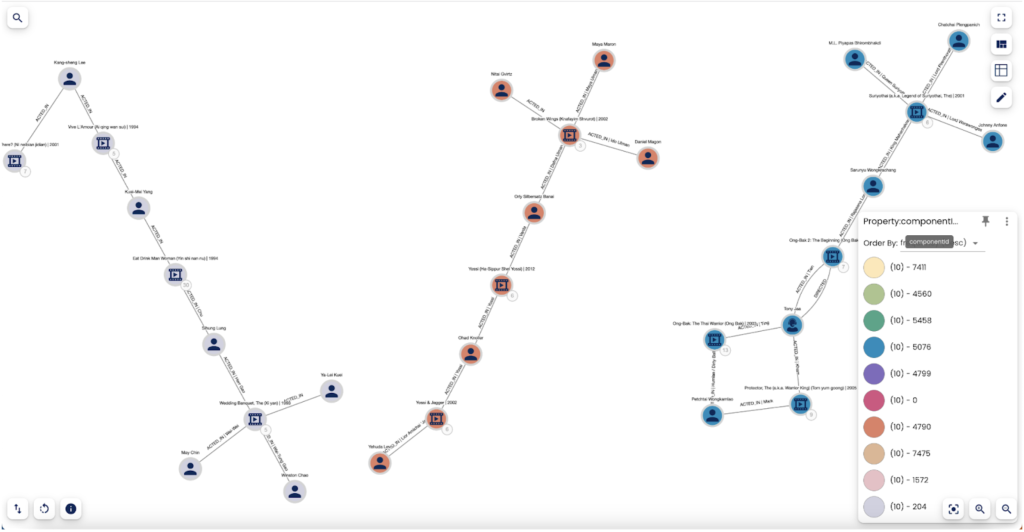
In this example, shown in Galileo.XAI, we applied the Weakly Connected Components algorithm of Neo4j’s Graph Data Science in order to find sets of connected nodes in the graphs. We can thus study the connections of the network and the subdivision of the network into communities in order to represent subnetworks.
In Weakly Connected Components (WCC) two nodes are connected if there is a path between them regardless of the direction of the relationship.
A community is represented by a set of all nodes that are connected with each other.
The figure represents three of the total connected components found on the entire network.
Besides the main algorithms, for graph databases, there are node embedding algorithms typically used as input to downstream machine learning tasks such as node classification, link prediction and kNN similarity graph construction.
They therefore also play an important role in the field of Machine Learning and Artificial Intelligence, of greater importance nowadays.
Conclusion
In conclusion, we have seen how in a world where data is growing exponentially, changing rapidly and not always having fixed structure, there is necessarily a need for a graph data structure.
Nowadays, we can represent as a graph almost everything around us. Think about the internet, social networks or communications networks as a map of the city.
Graph databases allow us to easily manage time relationships within a network especially for those real-time models that frequently need updates.
Moreover, they are increasingly used because they are indispensable for the application of machine learning and artificial intelligence analysis.
We are therefore facing an innovative model that is becoming increasingly important and is a fundamental support for network science.
So, we just have to say, let’s study graph databases.
A special thanks to our contributors:
Laura Di Egidio & Miriana Pompilio