We are in the middle of the Data Driven era and the number of companies owning a Data Lake is constantly increasing. As a consequence, polyglot persistence has become a must-have requirement to optimise derived value and decrease computational times in different business cases.
Companies involved in the challenge of leveraging connected data to optimise recommendations and understand behavioural patterns, are searching for systems capable of representing these data and speed-up analysis. Graph-based solutions become then crucial in these highly-connected scenarios.
Introduction
In this article I will make a short introduction about knowledge graphs and present the use cases where it fits naturally. I will then give some insights on why using a graph data science approach can also improve algorithms performance. Lastly, I will talk about Graph-AI and Explainability, showing a quick example on our Graph Data Science platform Galileo.XAI.
Knowledge Graph
Graph Representation
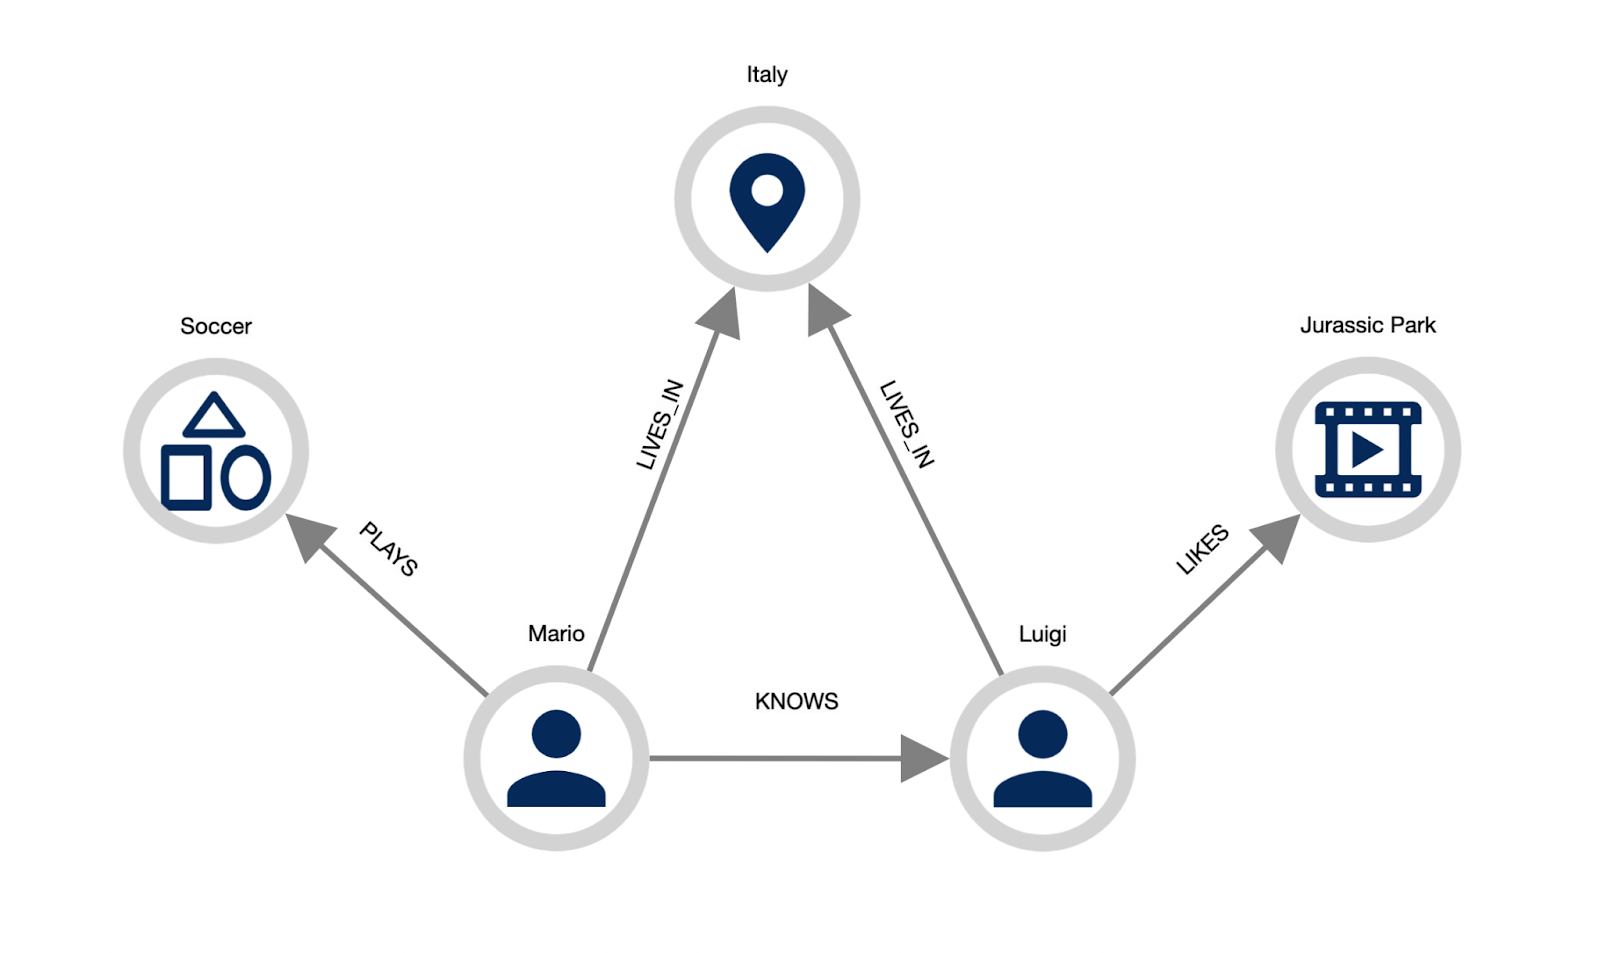
Graphs are everywhere: every kind of knowledge and process can be represented as a graph connecting pieces of information.
People are connected to each other, to the places they live, work and have fun.
As you can see in the image below, it is really straightforward to translate the graph representation into actual knowledge that we can easily understand.
Therefore we can summarise that a graph is a way of representing a complex world by describing it in relatively simple terms, capturing essential aspects and emphasising connections.
Natural Networks
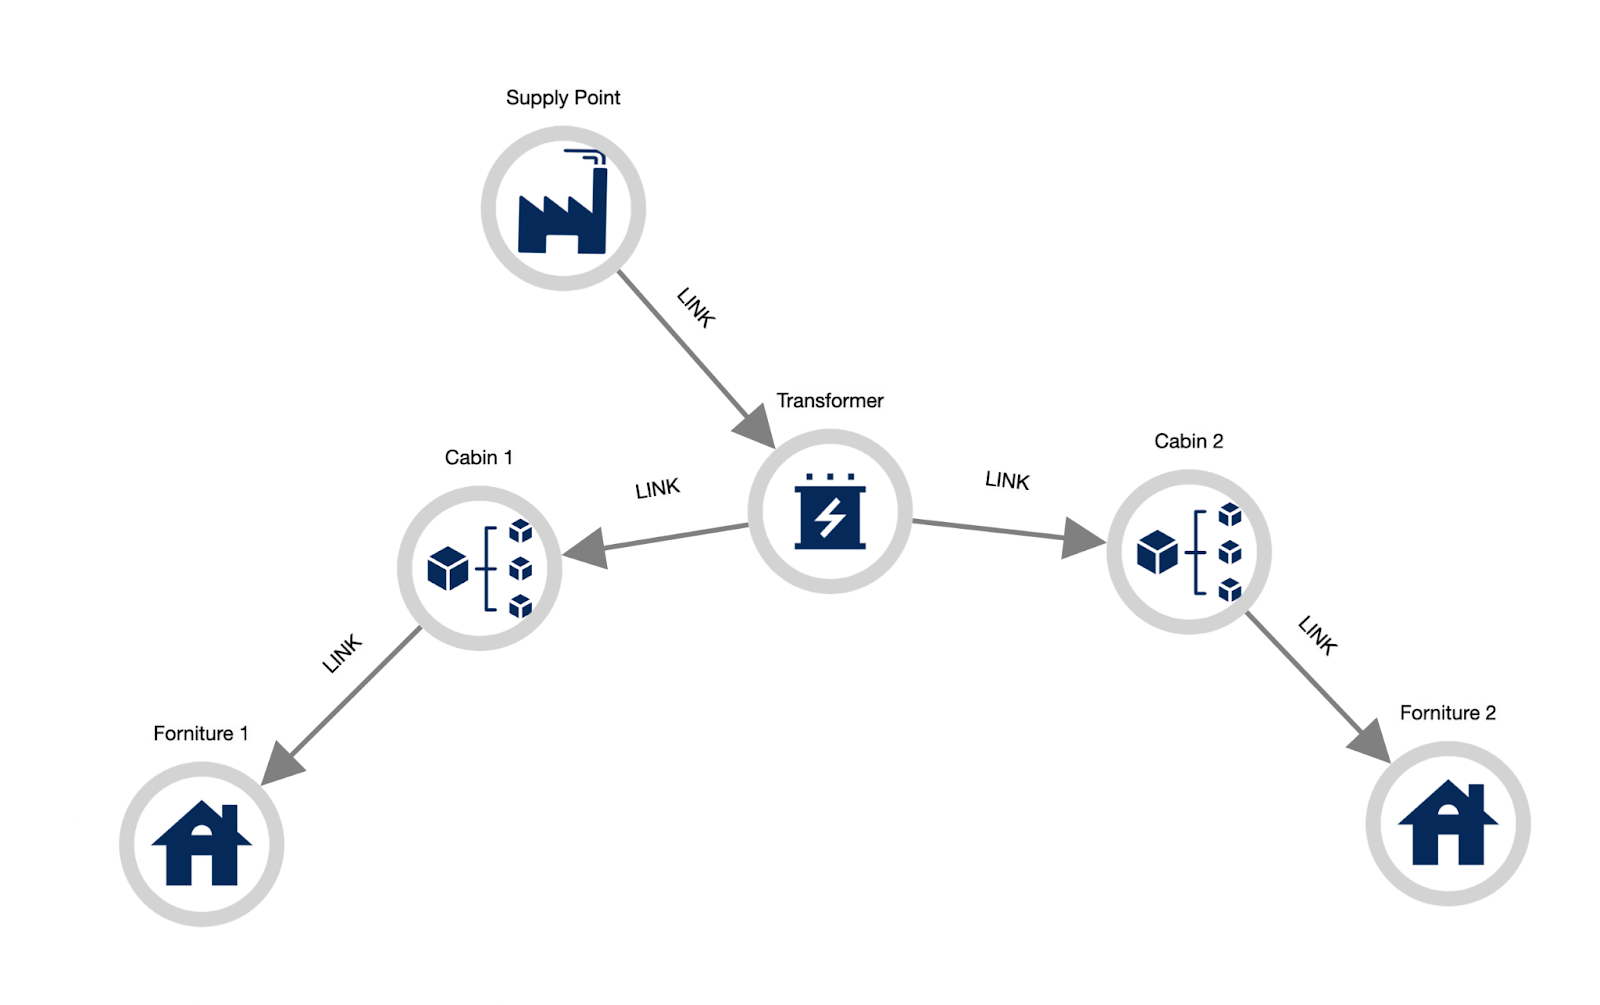
We do can represent every piece of information as a graph. But still, there are situations where the graph representation approach fits excellently and we should always preferred it. This is the case of “natural networks”, physical and non-physical infrastructures, networks and processes that are inherently connected per se.
Power Supply, Road and Subway Networks, are great examples of natural networks that can be modelled as a graph. Supply Chains and Biochemical Processes are good examples for the non-physical networks domain.
Tables vs Graphs
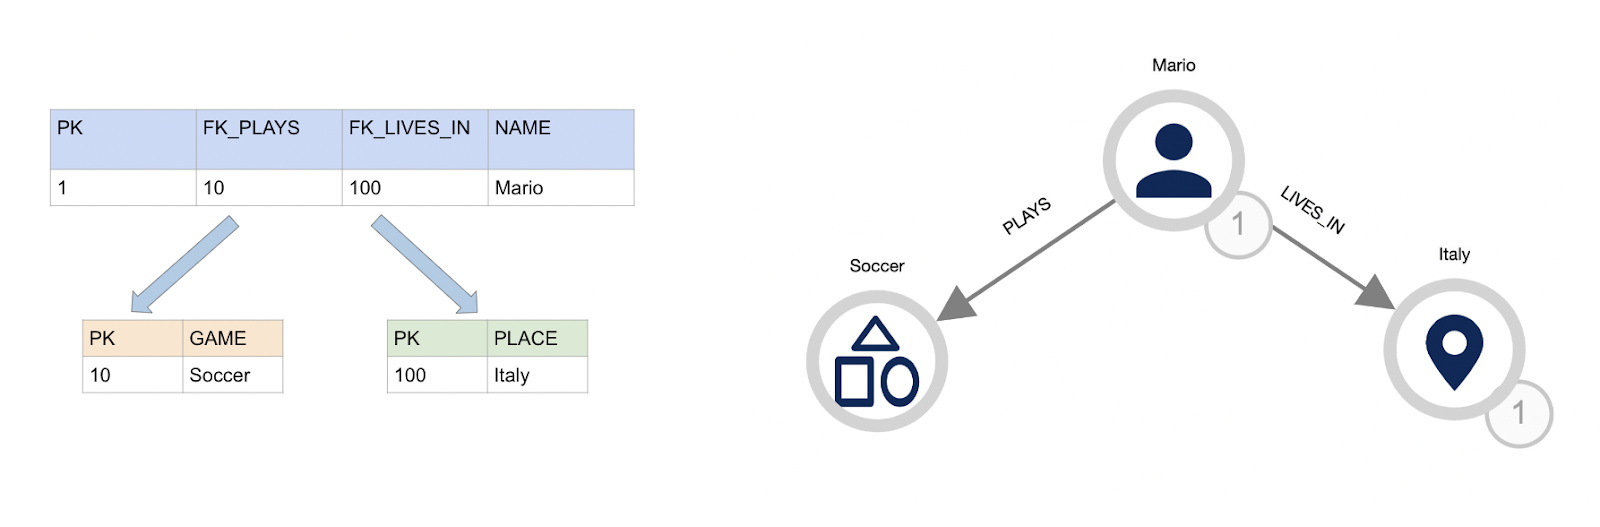
We are all familiar with tables, we’ve been working with them every day, our databases are built around tables. Tables for sure operate well when we need to analyse individual pieces of information that can fit in a table record. They also work well as for aggregated and ordered outcomes.
However tables do not give us the same straightforward representation provided by graphs. This is especially true when it comes to the necessity of having a much bigger understanding of a phenomena. They fail to do so when there are several connections between data points. Foreign keys and record-like visualisation make us difficult to have a full sight on the phenomena.
Graph Data Science
Overview
Graph models are more expressive and more indicated for highly-connected scenarios. In addition, they also offer a big help when it comes to Data Science analysis.
Graph gives data scientists the ability to understand and analyse connections between data points, providing critical context we cannot otherwise capture in a tabular data model.
Data Science’s analysis usually focus on understanding the importance of the data points as well as defining communities among them. Think of PageRank or Clustering algorithms for example.
Connections between data points are therefore crucial to run these analysis and to understand and rapidly validate their results.
Technical Insights
The main thing to understand when we talk about Graph Databases, is that they don’t define connectivity using foreign keys. Instead, they explicitly store the connections between data. This means that there is no necessity to run complicated and expensive multi-table join queries to find the relevant connected data.
Also, most of the Data Science algorithms rely on connectivity. For this reason we can completely avoid the pre-processing step using a Graph Database.
This reduces execution time to a few seconds instead of hours for algorithms using connectivity between data points.
“GDMBSs show their superiority under the workloads that mainly consist of multi-table join, pattern match, path identification, and their combinations.”
Graph AI & Explainability
Context-Enriched Analysis
Lack of connections means lack of knowledge. Connections allow us to understand behaviours, dynamics, interactions and to determine how phenomena occur. This is crucial in order to predict what will happen then.
Connected data thus becomes fundamental information for AI, as it creates a context for better learning.
Moreover, complex scenarios often need sophisticated model’s features, usually derived from data science algorithms. Therefore leveraging graph data science capabilities can optimise the whole model pipeline.
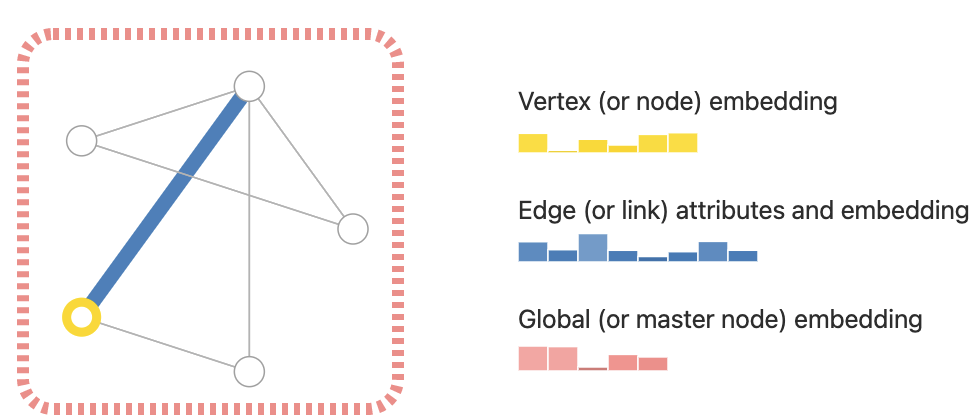
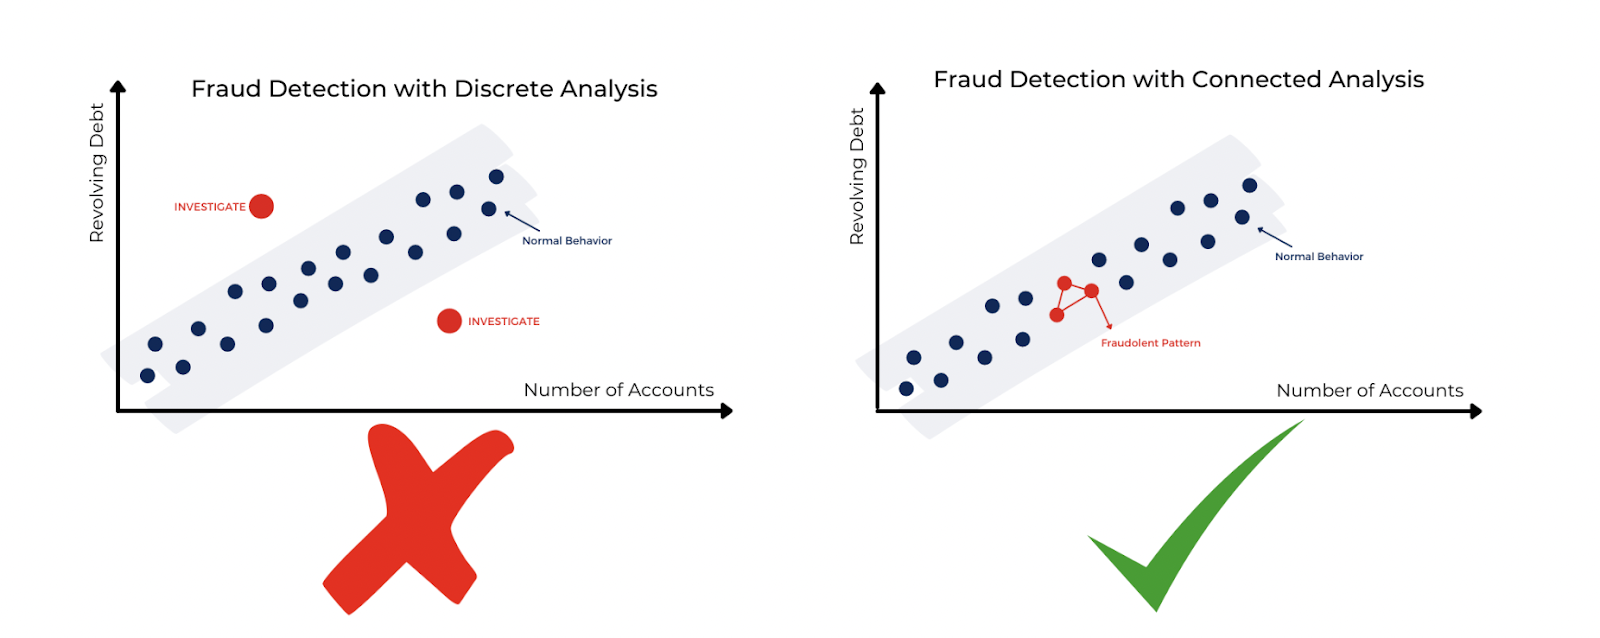
In the image below there is an example of what we are talking about. By excluding connections from learning we are excluding important knowledge from it. This could, instead, let the AI better recognise patterns.
Explainability
Explainable or interpretable AI is characterised by the fact that human beings are able to comprehend its decisions. It is strongly linked to the “right to explanation”. Human beings do have the right to receive an explanation for a result that has an impact on themselves (generally in the legal, financial or health).
The EU wrote the guidelines for an ethical use of AI along with the characteristics that make an AI a trustworthy AI. One of the key points of these guidelines is, in fact, Transparency.
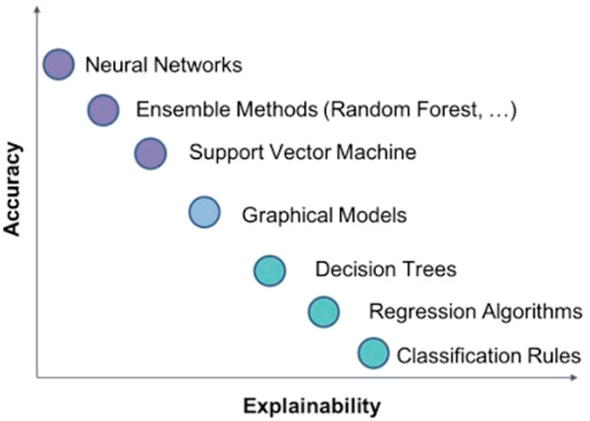
In cases where the right of explanation is a must, black-box AI models are not eligible, since they cannot accomplish transparency. Think for example at Neural Networks models where the weights of the network’s nodes hides the importance of a particular feature.
So, the same enriched-context mentioned before, becomes a fundamental tool to also explain the AI models’ predictions, driving the technology in its application journey through more complicated and delicate decision tasks.
In fact Graph AI can give us the possibility to have dedicated Explainability methods for GNN as well as Decision Trees that are highly explainable.
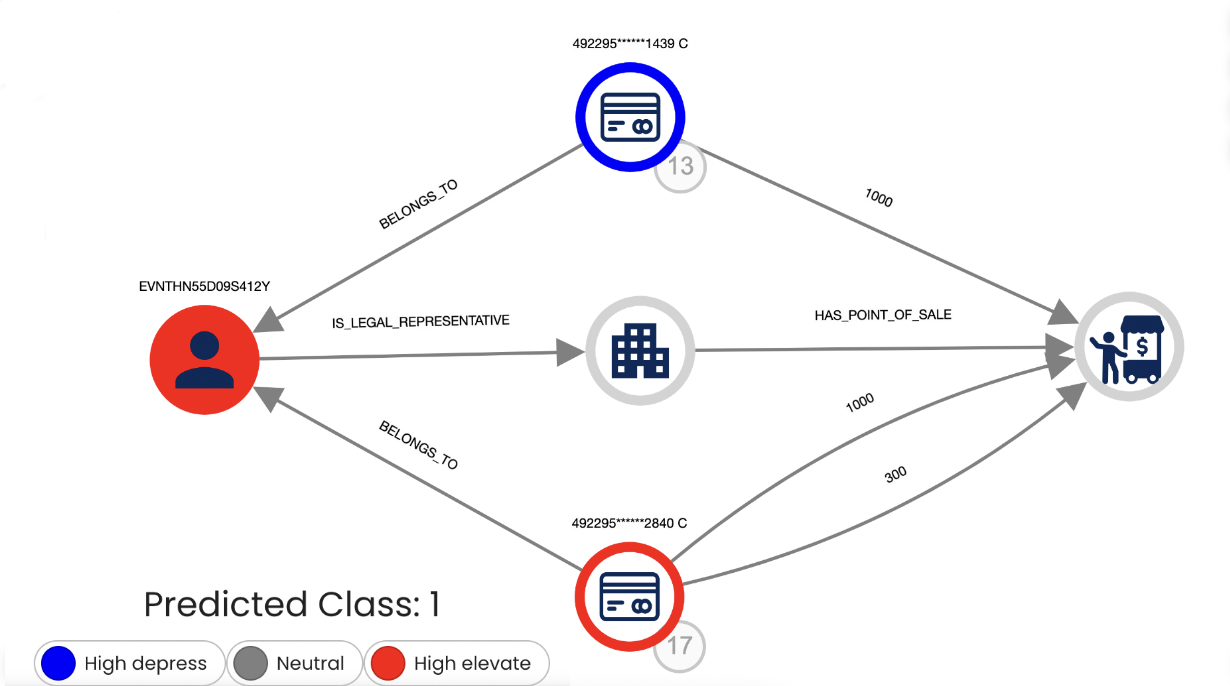
Moreover the graph visualisation gives us also the graphic perspective for the explainability. Below there is an image showing an explainability on Galileo.XAI for a case of Self-Financing. We can see a user and its indirect connection to the point of sale. We can also observe his/her connection to a credit card making transactions to the point of sale. This all combined led the AI to correctly mark the case as suspicious. The colour legend give us information about the importance of the model’s features.
Galileo.XAI
Graph visualisations, explainability and AI related models, presented in the article, come from Galileo.XAI, a Graph Data Platform developed here at LARUS.
The solution gives you the ability to explore your connected data easily and to run complex pipelines for data science and AI using a no-code/low-code approach. All of this without any learning requirements about graph databases and cypher query language, helping you in the transition between the relational and the graph word.
Jump on the site and have a quick look!
A special thanks to our contributor:
Roberto Sannino